Insights
The uneven structure of the AI economy: A profit-engine map

📄 Download the strategy brief (PDF)
Most investors analyse AI exposure by company. That is the wrong unit of analysis. Azure captures AI spend through existing cloud contracts without a new buying decision. Microsoft 365 Copilot must convince enterprises to pay separately for AI features they may soon expect as standard. Same company, different economics entirely. Analysing by company collapses the economics and buries the structural error until it surfaces quarters later.
The question that matters is structural: who captures value,
what makes the position hold, and what would break it?
Answering that question requires a different lens. This strategy brief maps the profit engines of the AI economy along two structural dimensions, sorts them into four roles, and identifies the breakpoints that should force a thesis review. The goal is not to pick winners. It is to give boards, investors, and strategy leaders a structured way to distinguish the risk they intend to carry from the risk they are carrying without knowing it.
The AI profit-engine map
The map classifies profit engines using two dimensions.
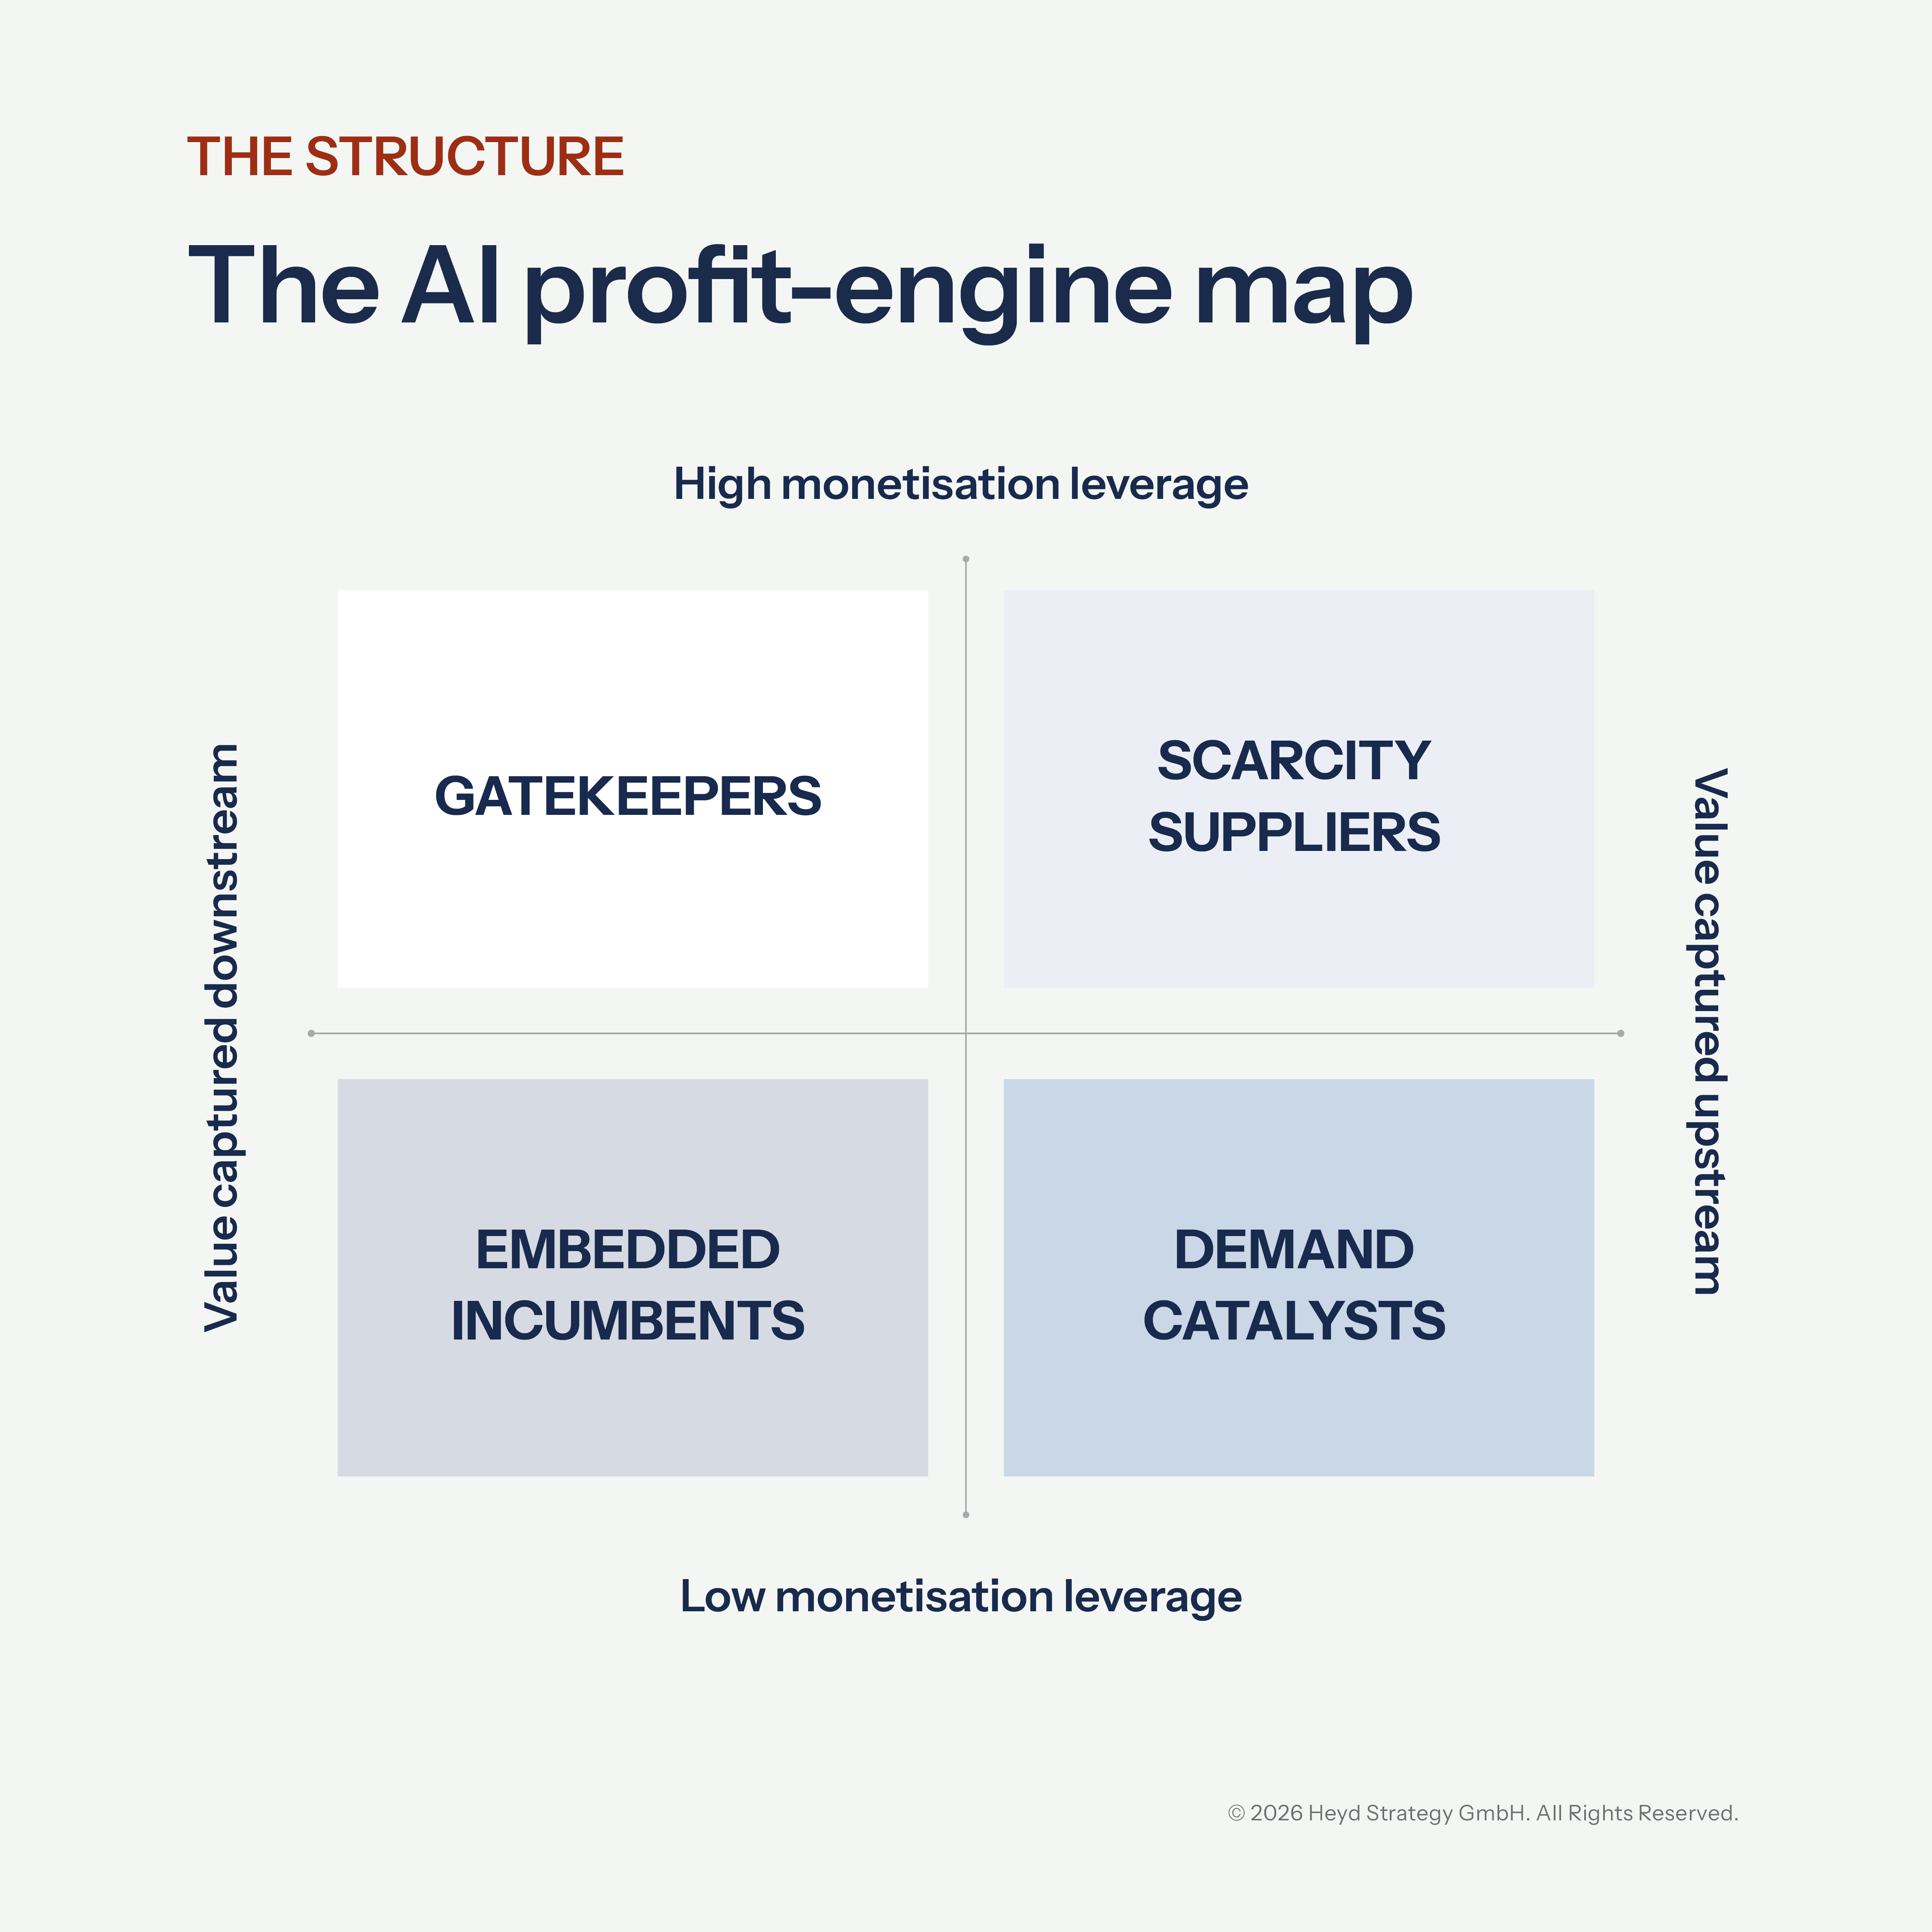
First, monetisation leverage: how effectively the engine captures value, through pricing power, yield improvement, or structural cost advantage. High-leverage engines typically occupy defensible bottlenecks: physical scarcity, capacity others depend on, or a routing surface demand must pass through.
Second, value chain position: where the engine captures value in the industry value chain, upstream through physical scarcity, compute capacity, or capability advantage, or downstream through demand routing, workflow ownership, or distribution control.
Together, these dimensions produce four roles: Scarcity Suppliers capture value because upstream supply is hard to replicate; Gatekeepers capture value by controlling how demand flows; Embedded Incumbents own workflows but must persuade buyers to pay for AI rather than treat it as standard; and Demand Catalysts expand capability and stimulate demand but face structurally weaker profit capture.
These positions are not permanent. Over time, value tends to pool at defensible bottlenecks with self-reinforcing advantages, upstream scarcity and downstream routing surfaces. But high leverage is not automatically “better.” It describes returns per unit, not total profit. Low-leverage engines can still build large profit pools as AI scales, but rely more on volume than margin. The most consequential moves are integration plays that shift where advantage sits: downstream players building upstream capability, upstream players extending toward the demand layer. Track the direction of integration, not just the current position.
The asymmetry behind the AI cycle
The current AI cycle has an asymmetry that most frameworks understate. The profit engines with the strongest near-term economics face the most concentrated duration risk, while the engines generating the most demand tend to sit where profit capture is structurally weakest. That is not a coincidence. It is the structure of this market.
Scarcity suppliers sit at the upstream end of the industry value chain. They get paid because supply is scarce and capacity is hard to replicate. NVIDIA’s data centre GPU business, TSMC’s advanced process nodes, and ASML’s EUV lithography systems are the defining examples. ASML is worth noting separately: most leading-edge AI chips pass through its machines, and it has no competitor at scale for EUV yet.
The largest buyers are not passive. Custom silicon programmes at Google (TPUs), Amazon (Trainium), Meta (MTIA), and Microsoft (Maia) are backward integration moves designed to reduce dependence on upstream scarcity. If they reach production scale faster than assumed, the premium compression could be sharper than consensus expects.
Gatekeepers control the downstream demand layer and capture AI value through existing defaults. This role has two distinct subtypes that share the same structural logic but face different risks. Ad-driven gatekeepers benefit because AI may amplify yield on an attention surface billions of users already visit daily. Meta is the cleanest illustration: AI improves targeting, which lifts yield per interaction, which increases advertiser demand, which raises the average price per ad, which makes the capex visibly self-funding. Infrastructure-driven gatekeepers (e.g. Azure AI services, AWS AI services) benefit because enterprise AI workloads default to the installed cloud provider without a new vendor decision. Azure’s AI platform layer functions as a gatekeeper in this map: enterprises orchestrate multiple AI models through a single environment, and AI consumption flows through existing contracts. What the two subtypes share is the same logic: AI value is captured through defaults, without a new buying decision. The main failure mode is not model quality. It is the control point becoming contested.
Embedded incumbents own the downstream workflow and sit closest to the buyer’s daily operations, but AI requires a new buying decision. Microsoft 365 Copilot is the clearest example, and it illustrates why the gatekeeper/embedded incumbent boundary matters. Copilot sits inside the world’s most widely deployed productivity suite, yet monetisation depends on an explicit add-on license and a conscious budget decision. That is a fundamentally different economic position from Azure, where AI workloads tend to expand spend through existing consumption contracts and meters. Adobe Creative Cloud, Salesforce Einstein, and SAP Joule face the same boundary condition when AI features are introduced as paid add-ons instead of being absorbed into the base tier.
The risk is specific. If delivering an AI feature carries a meaningful per-user inference cost and users begin to expect it as part of the existing subscription, the vendor faces a three-way tension: charge separately, bundle AI and attempt to reprice the package, or absorb cost that compresses margins. The signal to watch is not adoption. It is the ratio of active usage to paid conversion.
Demand catalysts sit upstream, providing the AI capability that pulls through the entire value chain. They make the technology mainstream. They face structurally weaker profit capture. Many of these engines are trying to run two missions on one balance sheet: a commercial mission of packaging and pricing today’s capabilities, and a strategic capability race towards frontier systems that is capital-intensive and open-ended. Others, like Meta’s Llama, are funded by a gatekeeper parent and exist to strengthen a position elsewhere in the map.
Broad adoption compounds the problem. When millions of users have access to a free tier, the product becomes a reference point rather than a scarce resource. ChatGPT and Claude sit here with diverging strategies, one pursuing consumer breadth, the other enterprise depth, but a shared structural challenge: the broader the adoption, the harder it is to set terms.
Chinese frontier models, notably DeepSeek, Qwen, and Kimi, are compounding the pressure, reaching competitive quality and pricing aggressively, which accelerates the rate at which switching becomes trivial and pricing power erodes.
What the map tells you
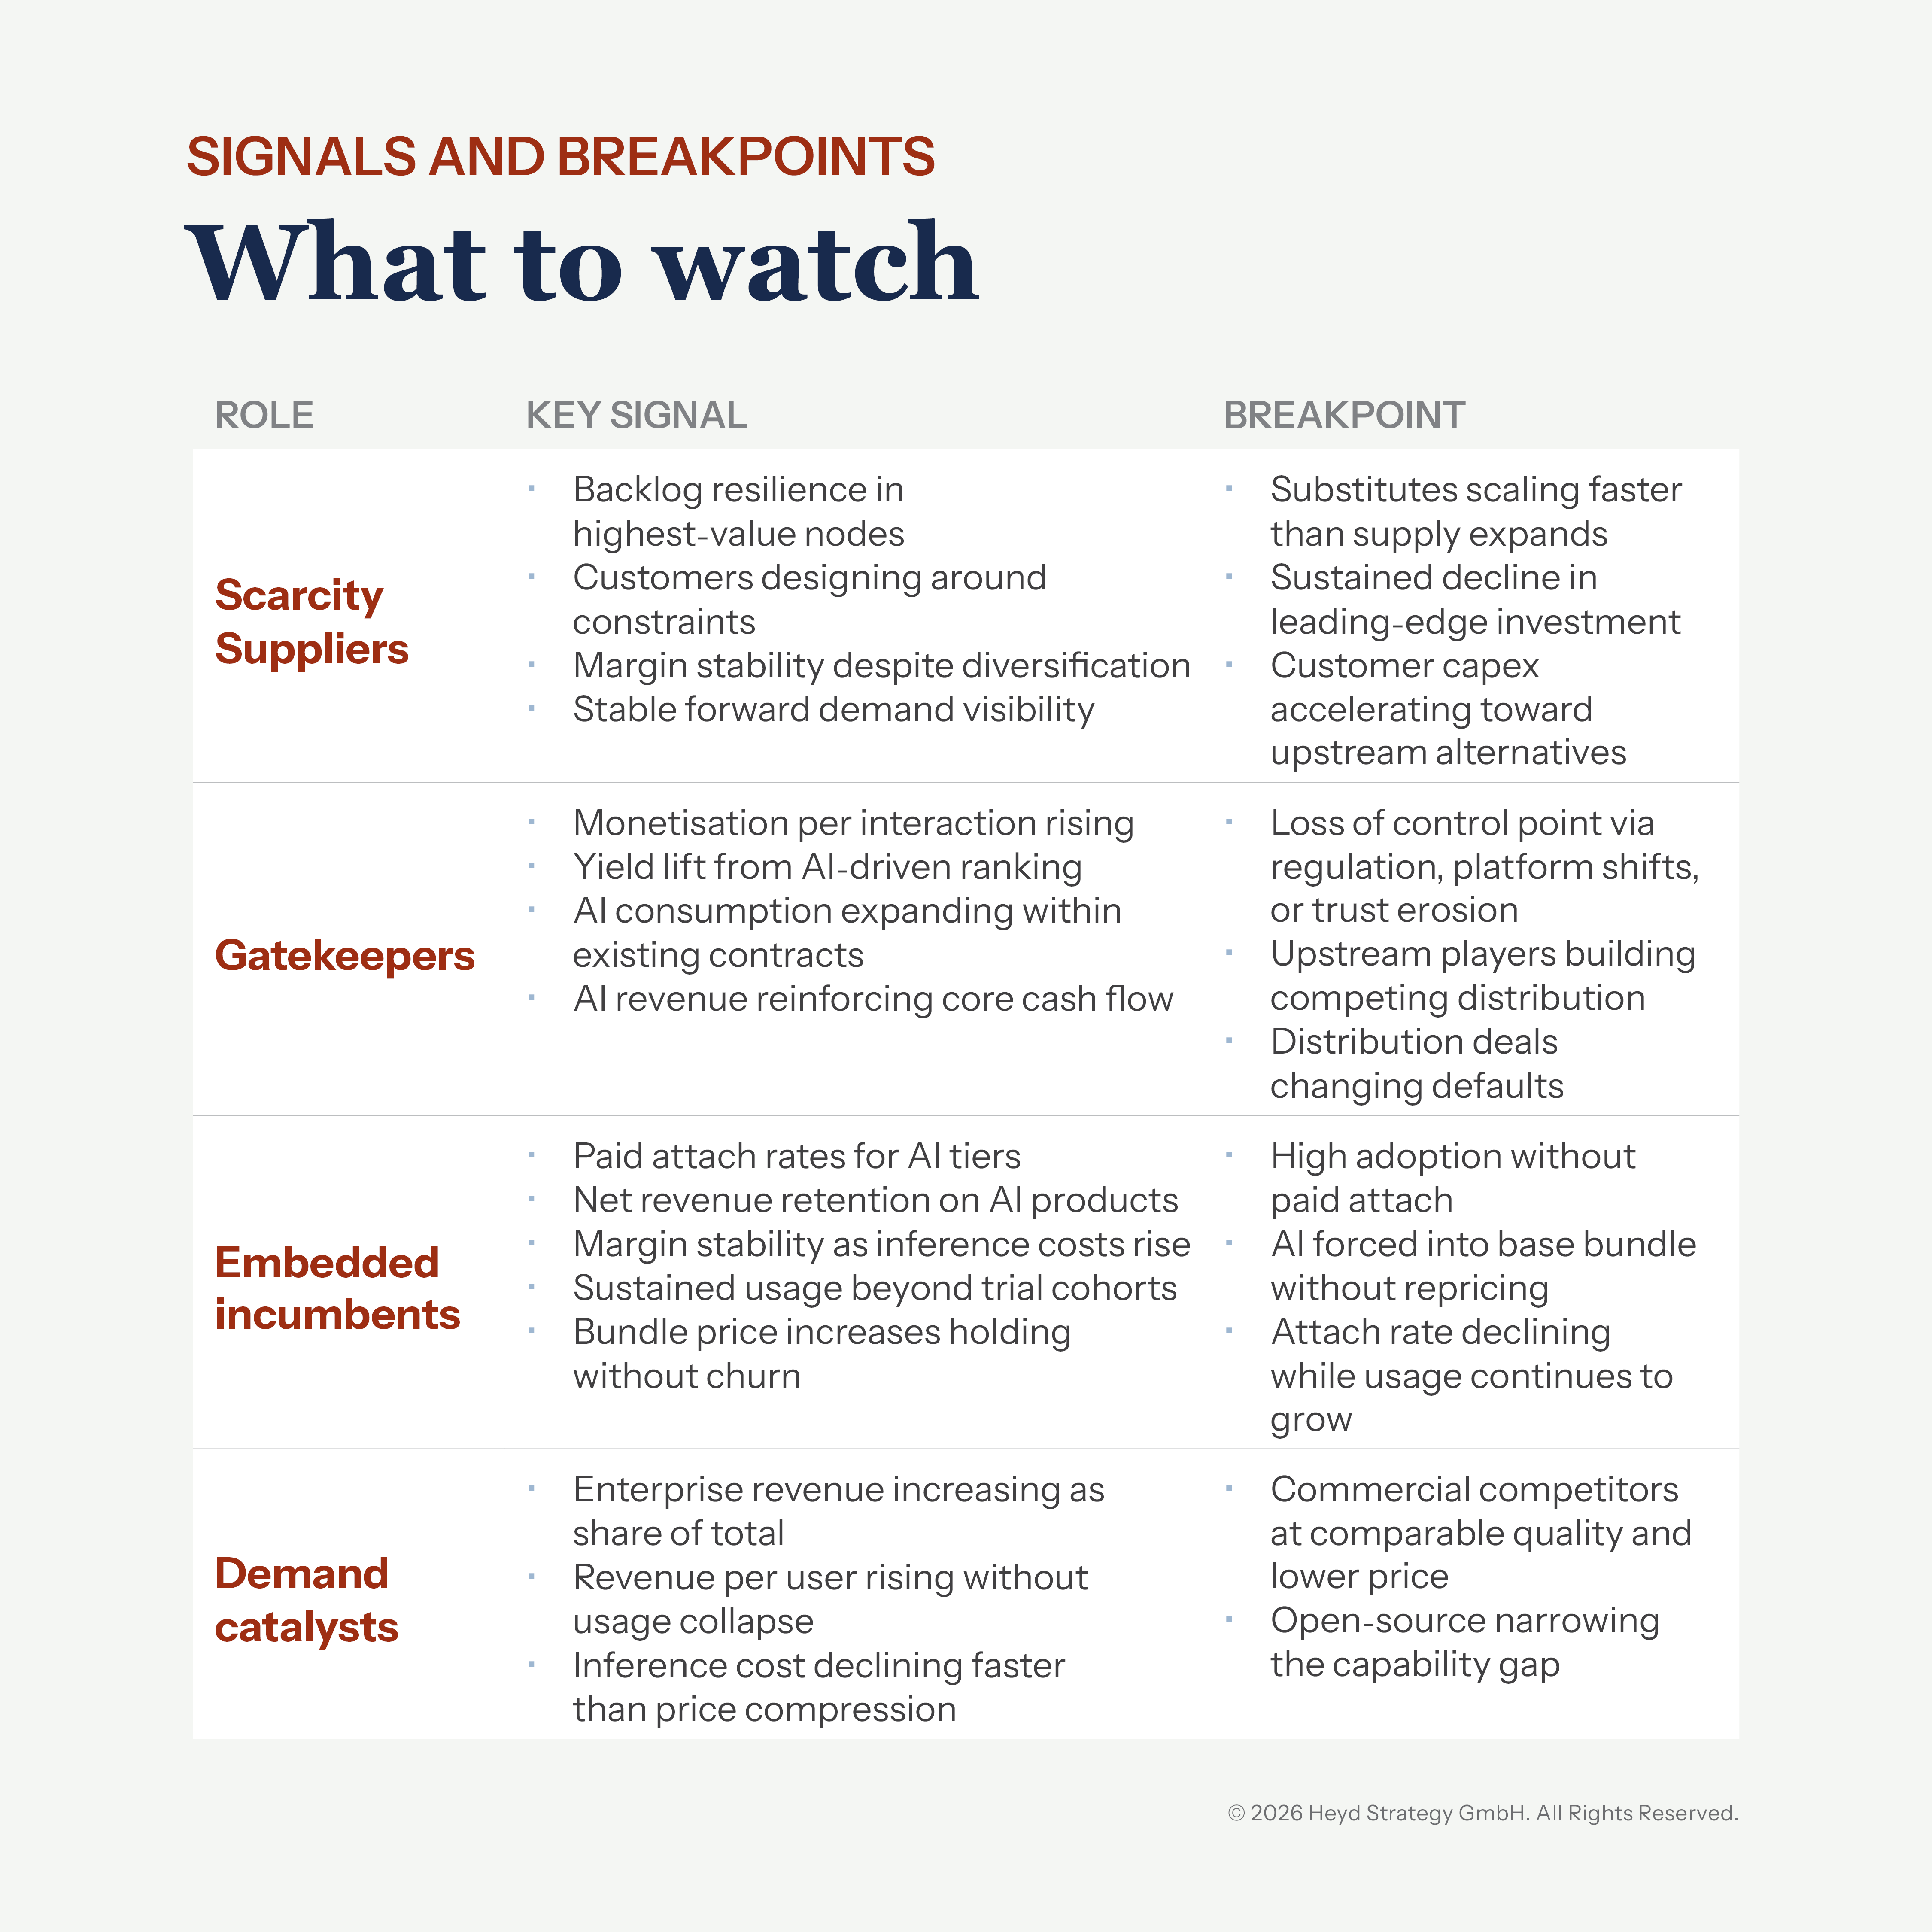
Each quadrant implies a different failure mode and different breakpoints that should force a thesis review.
Scarcity suppliers: the risk is duration and demand cyclicality. The breakpoint is evidence that alternatives are reaching production scale faster than expected, that major customers are building credible upstream capability of their own, or that the AI capex cycle is decelerating.
Gatekeepers: the risk is contestability. The breakpoint is regulatory intervention, attention displacement, multi-cloud strategies that weaken default capture, or upstream players extending into the demand layer through competing distribution.
Embedded incumbents: the risk is profit capture. The breakpoint is sustained high adoption with weak paid conversion, or competitive pressure forcing AI into baseline bundles.
The counter-signal is bundle price increases holding without incremental churn.
Demand catalysts: The risk is unit economics. The breakpoint is inference costs declining slower than pricing pressure, commercial competitors reaching comparable quality at lower price points, or open-source alternatives narrowing the capability gap to the point where switching becomes trivial.
These failure modes are not independent. The capex cycle funding scarcity supplier economics depends in part on capital flowing through the demand catalyst layer, and portfolios holding both carry more correlated risk than company-level analysis reveals.
Avoidable allocation errors happen when investors monitor the wrong signal for the quadrant they are in. If you are monitoring for the wrong failure mode, you tend to see the thesis break only after the market has already repriced.
Two signals show up early across the four roles: unit economics (is cost-to-serve falling faster than price pressure?) and buyer constraint (is the buyer becoming more or less locked in?). The table below breaks these down into the specific signals and breakpoints for each role.
For each of your largest positions, identify the constituent profit engines, the quadrant each occupies, and the signal that would prompt a thesis review.
The distinction matters. Without it, capital allocation reflects a narrative rather than a tested thesis. Narratives in this market have a half-life.
Movement pathways
Profit engines do not stay fixed. Movement on the map follows three pathways.
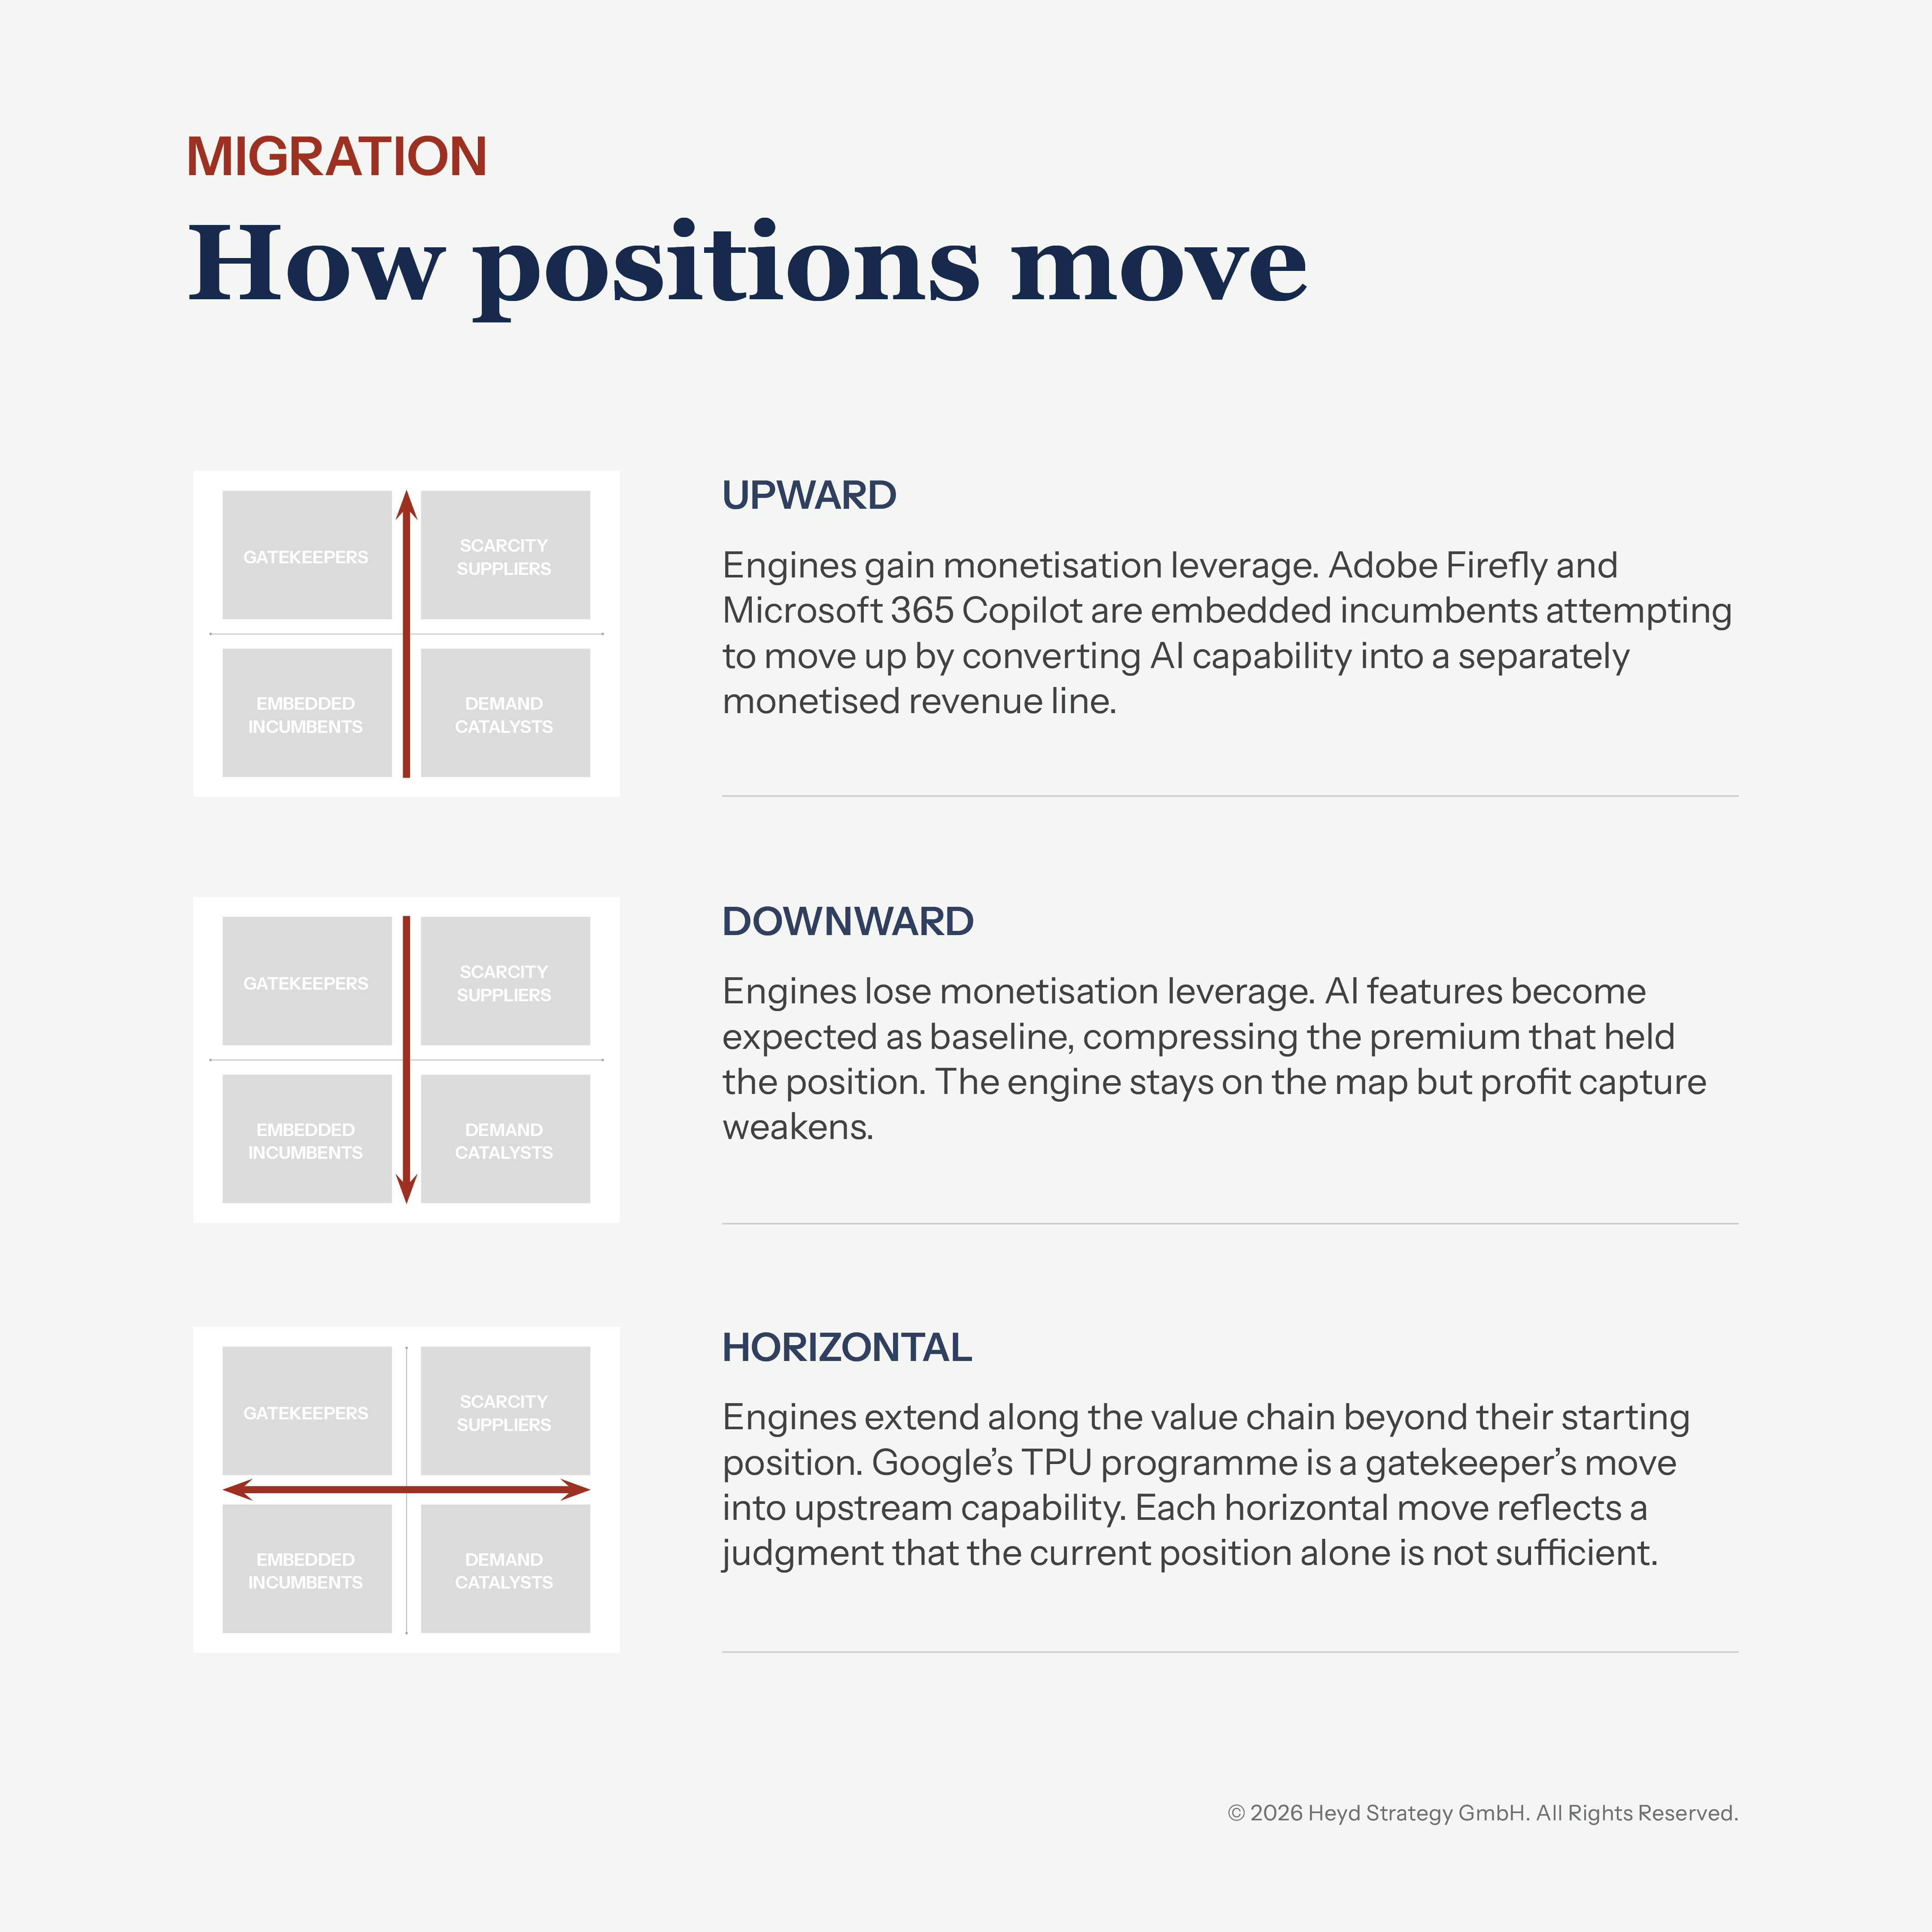
Beyond these three pathways, additional dynamics shape the map. New engines emerge in verticals that had no prior incumbent. Existing engines may be absorbed into a platform above them. The structural room within a quadrant can widen or narrow without the position itself changing.
The current position on the map matters. The direction of movement matters more. Each engine follows its own pathway, and each requires its own set of signals and breakpoints. Defining them is the work that boards, investors, and strategy leaders should not delegate to a general narrative.
These forces are already shaping returns across AI exposures. The map provides a structured basis for reviewing them.
Author: Dr. Frank Heyd
Related Insights


Stay up to date
Keep up to date with our latest news and insights
"*" indicates required fields